“Piled High and Deep”, www.PHDCOMICS.com, by Jorge Cham
Editor’s Note: This post by contributing author, Sanjay Malla, Research Scholar explains the rigor of the Confirmatory Factor Analysis and Structural Equation Modeling – a key requirement in the PhD programs of most Universities for empirically establishing statistical validity of the proposed model explaining the social phenomena under consideration. Tip: Do not underestimate the need for the statistical rigor in your research – it is critical to the defense of your work!
BEGINNERS GUIDE TO STRUCTURAL EQUATION MODELING (SEM)
By Sanjay Malla, Research Scholar; Semiconductor & Embedded Industry Professional
With the advent of high compute power machines that can handle huge amounts of data, the next generation of data analytics has emerged as the most advanced statistical analysis techniques. Structured equation modeling (SEM), is among the most powerful & versatile statistical techniques that has come up in the field of social sciences in recent decades. SEM is a second generation multivariate data analysis technique that combines features of factory analysis and regression, often used in marketing research because of its versatility to test theoretically supported linear and causal models. In marketing, researchers can visually examine the relationship between measured variables and latent variables as well as between latent variables.
There are many approaches to conducting SEM, one has to consider their pros & cons in order to choose the right one. The most widely used is covariance-based SEM (CB-SEM) and variance based partial least square SEM (PLS-SEM). CB-SEM is majorly used to confirm or reject theories, while as PLS-SEM is primarily used to develop theories in exploratory research.
In this article we will focus on Structural Equation Modeling with partial least square path modeling. PLS-SEM generally makes no assumptions about the data distributions and achieves high degree of statistical power with small sample sizes also. The fact that hard-to-measure latent variables can be used in SEM makes it right fit for handling marketing research problem. With PLS-SEM, researcher can visually display the hypotheses and variable relationships so as to priorities resource allocations and effectively address research problems.
Understanding the SEM components
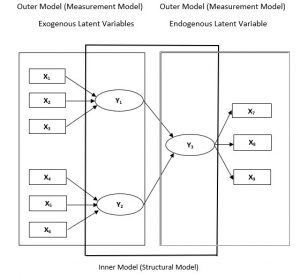
There are two sub-models in a structured equation model; first, there is a structural model (also called the inner model) that represents the relationships between the independent and dependent latent variables (also called constructs). This inner model also shows the relationships (known as paths) between the constructs. Second, there is a measurement model (also called outer model) that specifies the relationships between the constructs and their observed indicators. In SEM, latent variable is either exogenous or endogenous. Exogenous variable, has path arrows pointing outwards and none leading towards it. These variables explain other variables in the model. Endogenous variable, has at least one path arrow leading towards it and it reflects the effect of other variable(s). These variables are being explained in the model.
Figure 1: Shows the basic structure of Inner – Outer model of a simple PLS-SEM path Diagram.
Path models (Diagram) are developed based on theory. Two types of theory are used to develop path models – Measurement model theory & Structural model theory.
Measurement model theory explains how the latent variables (constructs) are measured, these Constructs can be measured in two different ways. One approach is called as reflective measurement and the other is known as formative measurement. Constructs Y1 and Y2 are formative based measurement model indicating that the indicator variables actually cause the measurement of these constructs. Also note the direction of arrows is pointing from the indicator variables (X1 to X3 for Y1 and X4 to X6 for Y2) to the constructs, indicating variable X causes the formation of construct Y. Compared to Y1 / Y2 in figure 1, construct Y3 is based on reflective measurement model in which the direction of the arrows is from the construct to the indicator variables, indicating that the construct Y3 causes the measurement of the indicator variables.
Structural model theory basically explains how the latent variables are related to each other. Here the relationship between the latent variables is explained by path coefficients. The placement and order of the constructs are strictly based on the combination of theory, researchers experience and knowledge. While path models are developed, the order that is followed is from left to right. Variables on the left hand side of the model are independent variables and variable(s) on the right hand side are the dependent variables. In the structural model, when constructs serve only as independent variables, they are called exogenous latent variables (Y1 and Y2). While as when constructs serve only as dependent variable (Y3) they are called endogenous latent variables.
Note: Next article in this series will attempt to explain all the key terms used in PLS-SEM. Also, use sample date to explain how the models are constructed and how the output results are interpreted.
Sanjay Malla
Doctoral Scholar
Semiconductor & Embedded Systems Professional